Over the past 10 and even 30 years, SMID cap companies have quietly outpaced large caps in earnings growth. Yet, large cap indices have dominated headlines, driven not by superior growth, but by soaring PE ratios. In this note Hugh Grieves, Fund Manager of the Premier Miton US Opportunities Fund, takes a look at the overlooked power of SMID caps.
Summary
- SMID cap earnings growth has actually been higher than large cap over both the last ten years and the last 30 years.
- Large cap index outperformance over the last decade has been driven entirely by large cap PE ratios expanding dramatically whilst SMID cap PE ratios have contracted.
- Drivers for further large cap multiple expansion are now fading (reversing?) making additional expansion difficult from current levels, and mean reversion possible.
Historically the case for investing in US small- and medium sized companies has been underpinned by their superior earnings growth rates compared to larger companies, which in turn has driven their long-term index outperformance.
Index Earnings 1995-2025 (rebased to 100)

Source: Bloomberg Finance L.P. 30.06.1995 – 30.06.2025. Past performance is not a reliable indicator of future returns.
Over the last 30 years, small and mid-cap companies have compounded earnings at an annual 10% rate, compared with only 7% for larger companies. For twenty years, from 1995 to 2015, this higher relative earnings growth translated into superior index performance as small and mid-stocks outperformed large companies, rising by 569% and 661% respectively compared to a 278% gain for large companies.
SMID cap outperformance compared to large caps 1995-2015 (rebased to 100)

Bloomberg Finance L.P. 30.06.1995 – 30.06.2015. Past performance is not a reliable indicator of future returns.
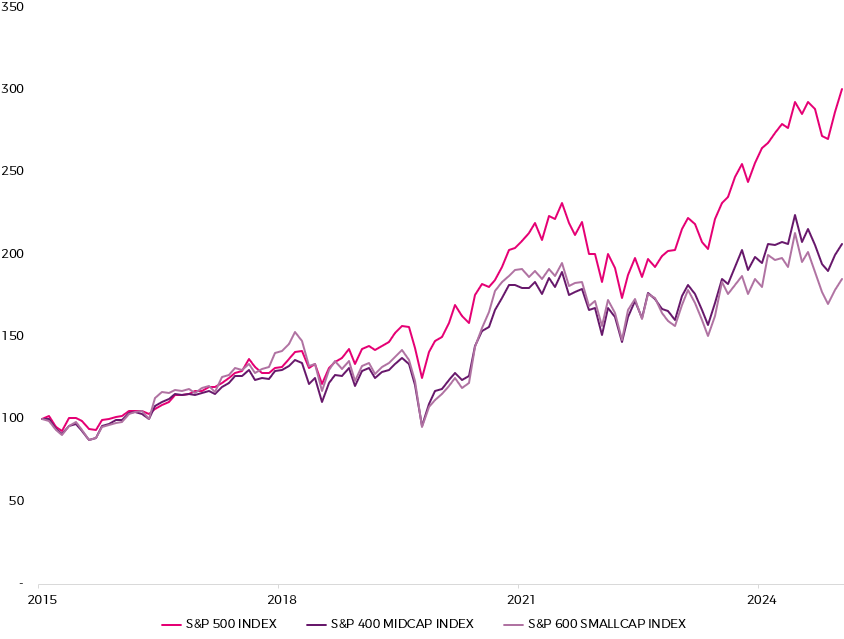
But over the last ten years it has felt like large cap stocks have been relentless outperformers compared to small and mid-cap US companies. The large cap S&P 500 has risen by 201% over the last ten years, compared to a 107% gain in the mid-cap S&P 400 and an 85% gain for the small cap S&P 600.
Large cap outperformance relative to SMID caps 2015–2025 (rebased to 100)

Bloomberg Finance L.P. 30.06.2015 – 30.06.2025. Past performance is not a reliable indicator of future returns.
So what has changed for US small and mid-caps over the last decade to reverse the trend of long-term outperformance?
Share price (and index) performance is a function of EPS growth and the change in the PE multiple. Over the long-term, earnings grow, and prices rise. Shorter-term, earnings can grow at a healthy rate, but if the PE multiple decline is sufficiently significant then any index/share price gain can be sharply reduced, or reversed. Conversely, an expanding PE multiple combined with growing earnings, can turbo charge short-term performance, albeit at the expense of future returns if multiples return to the long-term averages.
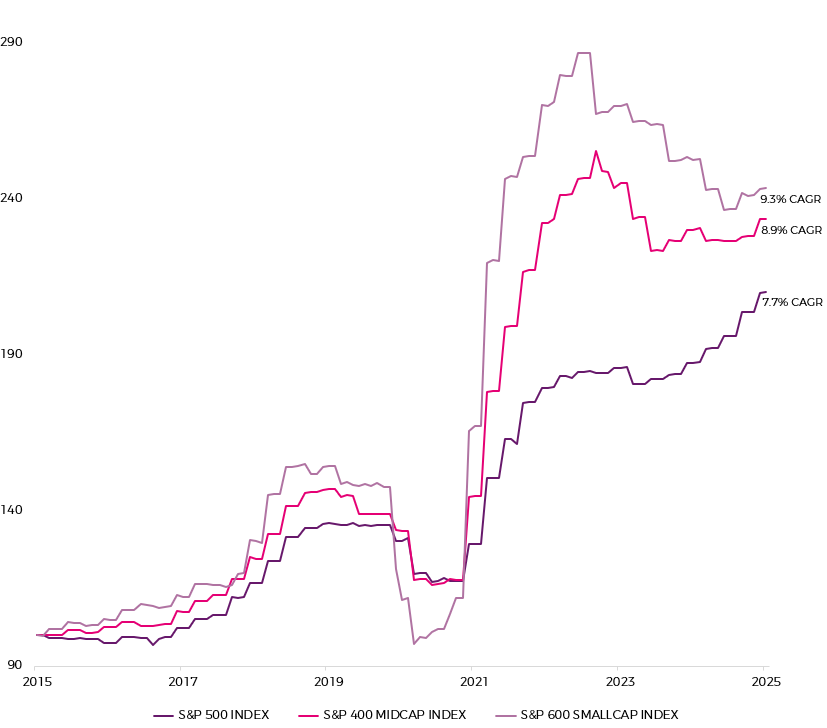
Over the last ten years, the headwind for SMID cap relative performance has not been slower earnings growth, which has in fact again been higher than large caps. Since 2015, small and mid-cap companies’ earnings have risen by 9.3% and 8.9% CAGR respectively (comparable to their ~10% long-term averages), whilst large caps have grown more slowly at a 7.7% CAGR.
Index EPS growth July 2015 – July 2025 (rebased to 100)

Bloomberg Finance L.P. 30.06.2015 – 30.06.2025. Past performance is not a reliable indicator of future returns.
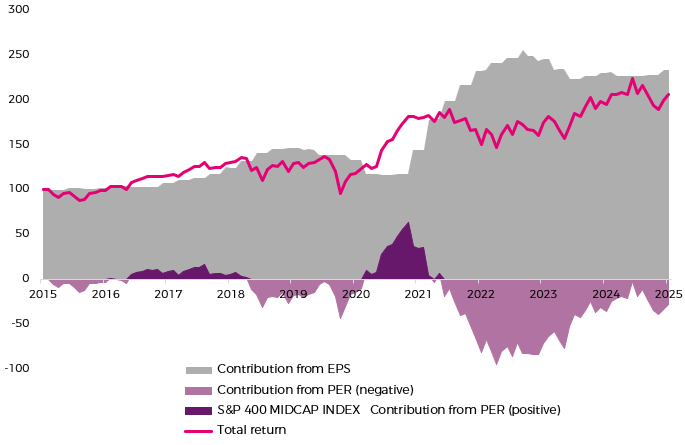
Instead, the entire headwind to small and mid-cap index performance has come from PE multiple compression over the last decade. In 2015, small and mid-caps traded on 21x and 19x earnings respectively but today they only trade on just 17x and 16x respectively, roughly a 20% decline. For mid-caps, this has resulted in an index return of 107%, lower than the 134% earnings growth over the decade. The effect for small caps is even more pronounced - 143% earnings growth but only an 85% index return.
S&P 400 – components of return (EPS + PER)

Bloomberg Finance L.P. 30.06.2015 – 30.06.2025. Past performance is not a reliable indicator of future returns.
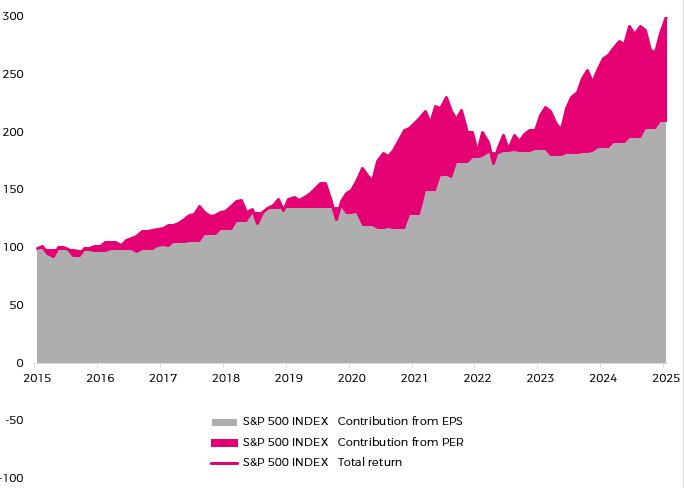
In contrast, over the same period, the PE multiple expansion for large caps has been a dramatic tailwind to performance. Today the S&P 500 trades on 24x, up from 17x in 2015, more than a 40% increase. Even as large cap earnings have grown at a slower rate (+110%) to SMID caps, the index has risen by 201%, almost double SMID caps.
S&P 500 – components of return (EPS + PER)

Bloomberg Finance L.P. 30.06.2015 – 30.06.2025. Past performance is not a reliable indicator of future returns.
All the relative outperformance of the SMID cap earnings has been lost, and more, by the relative underperformance of the SMID cap PE multiple, resulting in the significant large cap outperformance.
It is understandable to see why large cap multiples have expanded so much (but it is unlikely to be sustainable). Large cap earnings growth has accelerated over the last ten years from the previous twenty, reflecting the changing mix of the index towards a greater weighting to higher secular growth technology companies. Technology (by a broad measure) now makes up approximately 45% of the index.
Secondly, the changing mix has not just raised the overall growth rate but has also improved the aggregate quality of companies in the index towards a greater number of higher margin/ROE, high cash flow/low capital intensity quasi-monopolies (‘Magnificent seven’ for example) which investors typically pay a higher multiple for.
Thirdly, foreign investors have increased their weighting to US stocks for a variety of reasons including the scarcity of domestic (non-US) growth/returns which has added a further premium to the multiples paid for large, globally recognised US stocks.
For the large cap multiple to increase even further from here, these three trends at least need to be maintained. Instead, it is more likely that these trends reverse. Earnings growth for the Magnificent Seven is already under pressure from heavy capital investment in AI related hardware. The same investment is also hurting business quality, making these companies higher capital intensity, lower cash flow generating businesses as they struggle to fortify their eroding competitive moats. Finally, if alternative (ex-US) investment opportunities gain popularity, allocators will question why they pay such a premium for US exceptionalism.
Meanwhile small and mid-cap companies have maintained their earnings growth at similar rates to their long-term averages. But despite this consistency, small and mid-cap PE multiples have now fallen near historical lows. This gives some downside protection to further falls, and also potentially greater upside in a recovery.
Conclusion
- SMID cap stocks have continued to grow earnings at a faster rate than large companies over the last decade, consistent with earlier decades.
- Large cap relative outperformance has been driven by relative multiple expansion, not faster earnings growth.
- Limited scope for large cap multiples to expand much further, in contrast to SMID cap multiples which appear depressed.


Source: Bloomberg Finance L.P. Large Caps based on S&P 500 index; Mid caps based on S&P 400 index and Small caps based on S&P 600 index.
